For Class VI Underground Injection Control (UIC) well projects, monitoring vegetation health through multispectral data can be a valuable surface-based method for detecting subsurface anomalies and fulfilling permit requirements. This Delve explores the components of vegetation monitoring and how to leverage this tool to strengthen testing and monitoring systems.
Class VI UIC Well Permit Requirements
Class VI UIC well permits allow carbon dioxide (CO₂) to be injected deep underground for permanent storage in geologic formations. These permits require extensive testing and monitoring plans to manage site containment and environmental safety over time.
Monitoring requirements for Class VI UIC permits extend well beyond the deep injection zone. An effective monitoring system includes shallow subsurface and surface-level monitoring, where early signs of system variability or potential unintended CO₂ migration may first appear.
A strong monitoring program provides crucial context for interpreting system behavior over time, identifying early indicators of CO₂ migration, and differentiating between natural fluctuations of CO₂ in the shallow subsurface and genuine anomalies. This approach can prevent false positives that might otherwise result in regulatory delays or costly project shutdowns.
Vegetation Health as a Monitoring Tool
Plants are highly responsive to changes in root-zone chemistry, moisture, and gas exchange, making them ideal natural sensors of environmental change. If CO₂ migrates upward from the injection zone and begins to alter near-surface soil conditions, changes in vegetation health may be the first visible sign.
These stress signals can be identified using spectral data collected from satellites or unmanned aerial vehicles, which measure how vegetation reflects light across different wavelengths. By comparing these reflectance values to seasonal baselines, analysts can identify subtle changes that warrant further investigation.
This method of monitoring is especially useful for projects seeking certification under the California Air Resources Board (CARB) Low Carbon Fuel Standard. The CARB CCS Protocol (2018) explicitly requires ecosystem stress monitoring and recommends using remote sensing to track vegetation changes throughout the project lifecycle.
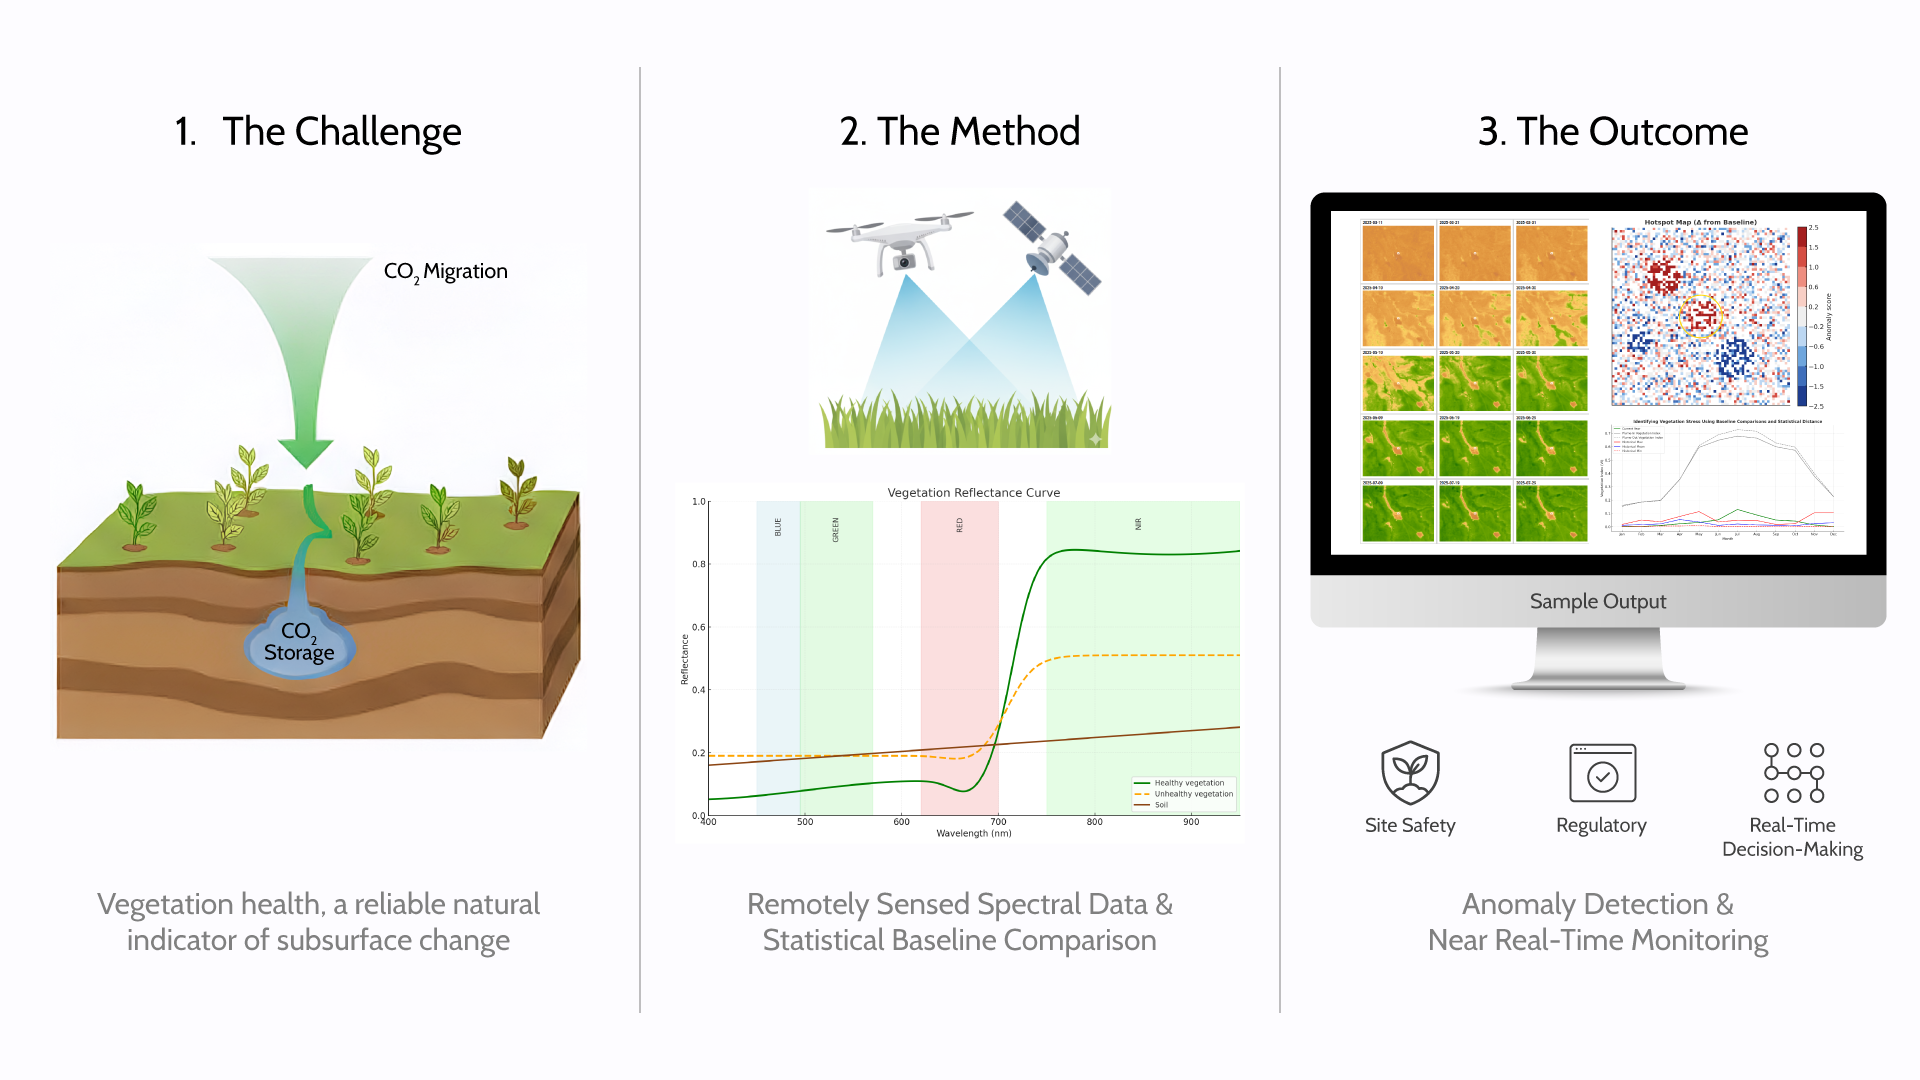
Figure 1: Monitoring vegetation health through multispectral data can be a valuable surface-based method for detecting subsurface anomalies and fulfilling permit requirements for Class VI UIC projects.
What Is Multispectral Data Analysis?
Multispectral data analysis involves interpreting how vegetation reflects light across specific spectral bands, including red, near-infrared (NIR), and shortwave infrared. These bands are sensitive to different facets of plant health, such as chlorophyll content, canopy structure, and water status, allowing early detection of vegetation stress.
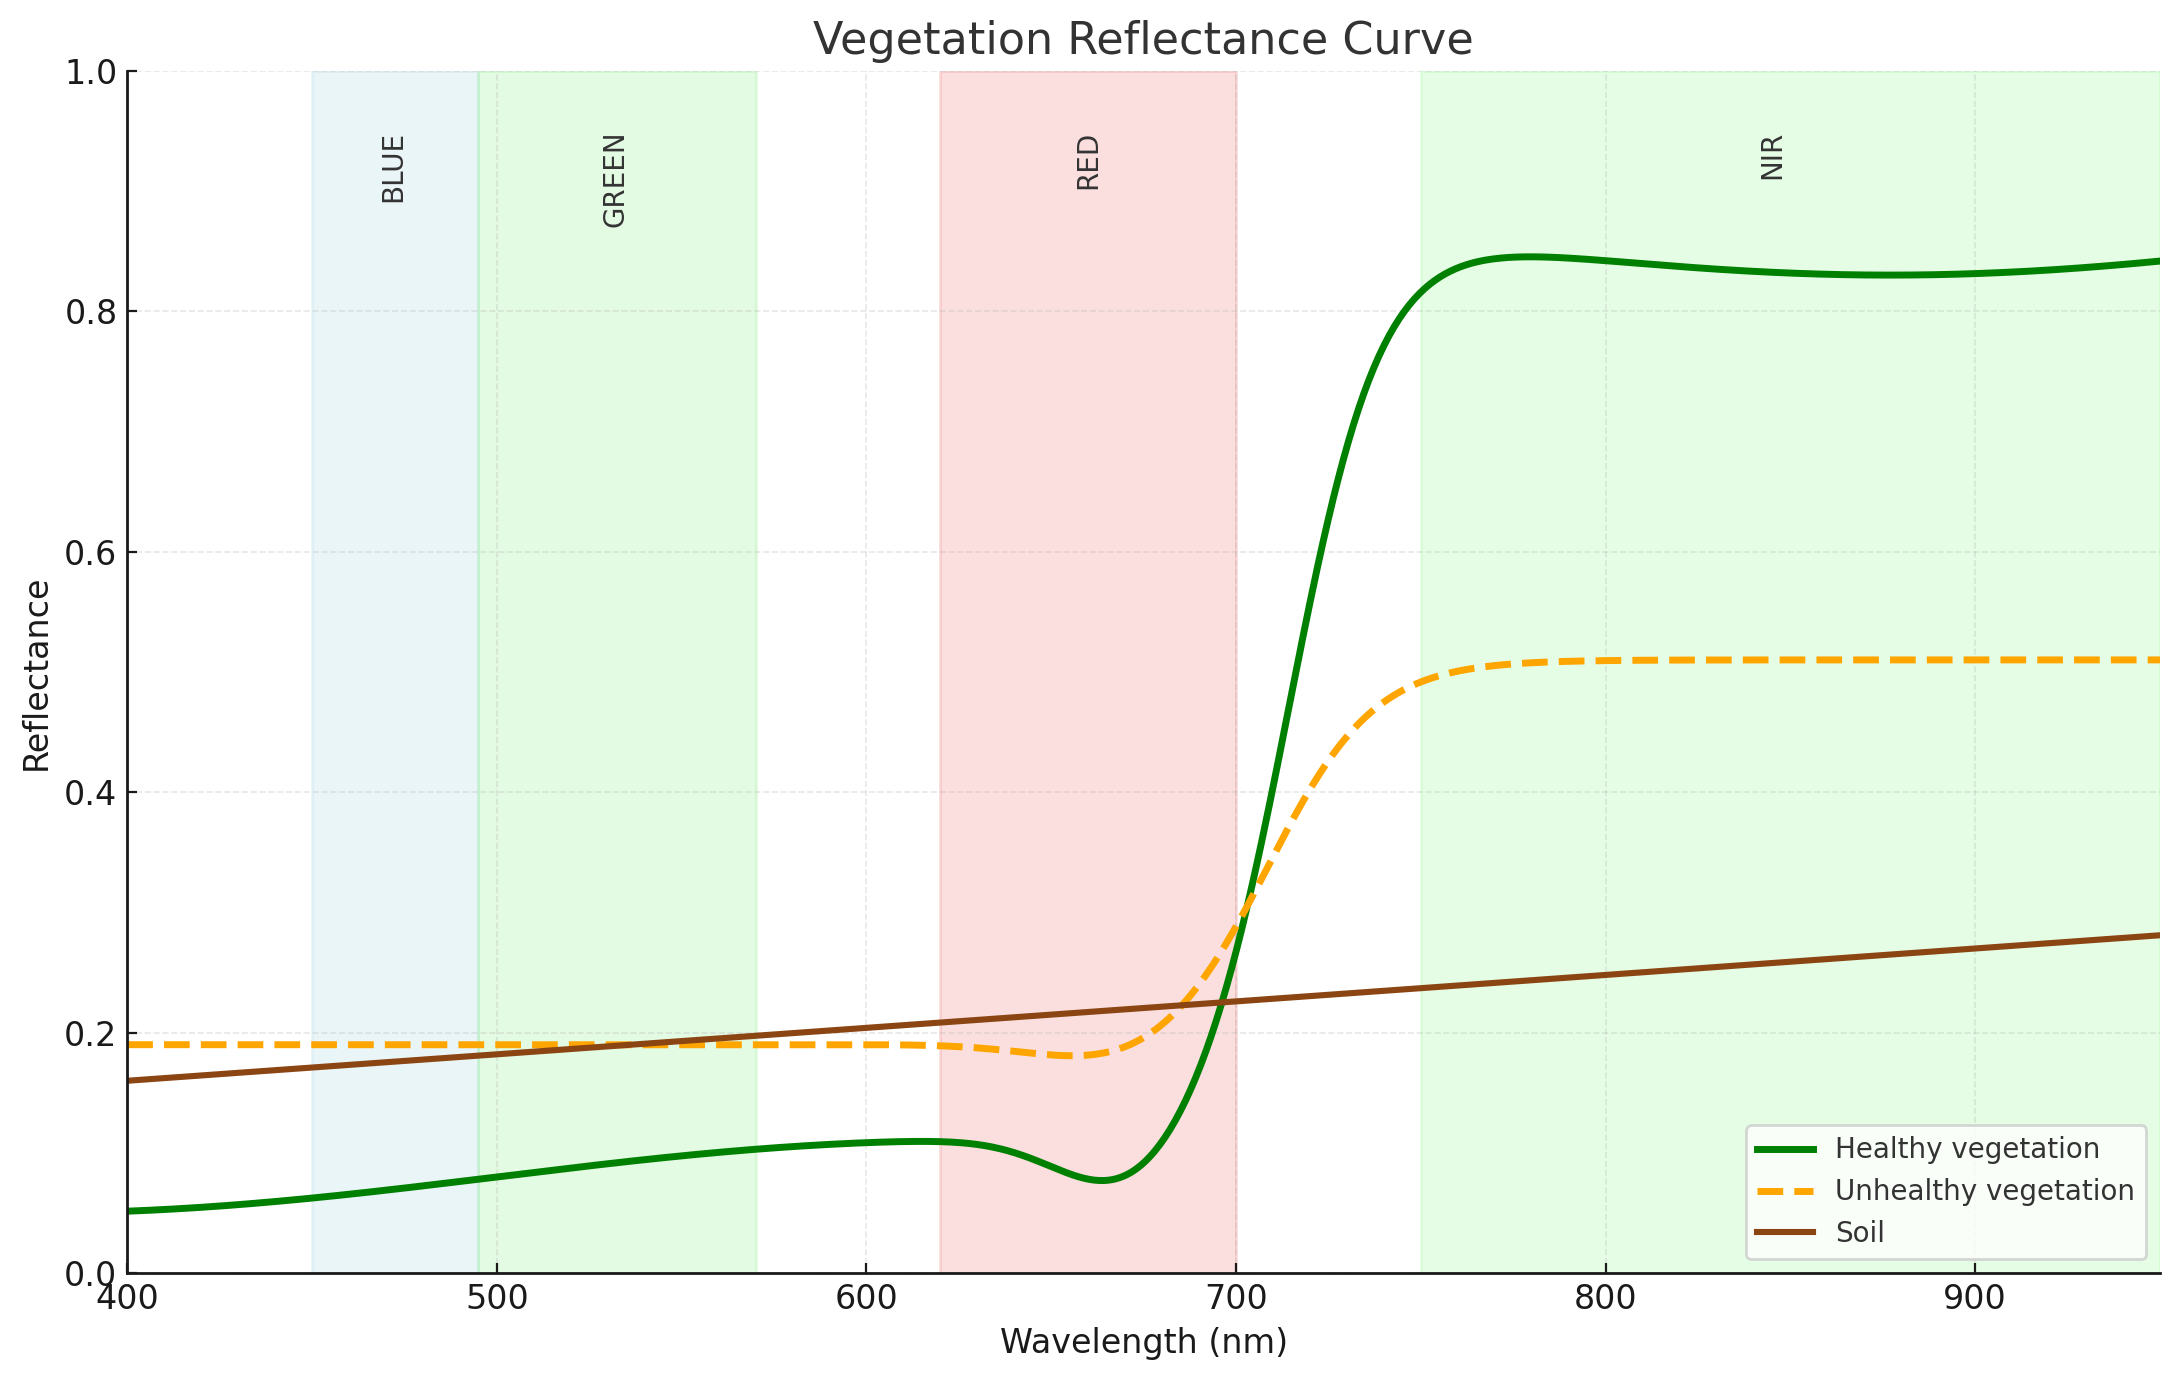
Figure 2: The reflective behavior of healthy versus unhealthy vegetation.
Figure 2 illustrates the reflective behavior of healthy versus unhealthy vegetation. Healthy plants reflect more NIR light and absorb red light, while stressed vegetation shows a muted difference between red and NIR regions. These patterns are the basis for commonly used indices like the Normalized Difference Vegetation Index and the Red-Edge Vegetation Stress Index.
Establishing a Baseline for Anomaly Detection
To effectively detect stress signals in vegetation, it’s essential to understand what “normal” looks like at each site. Rather than relying on broad regional averages or long-term climatology alone, building site-specific vegetation baselines using historical and recent satellite imagery, localized climate data, and statistical models can help tailor decision-making by operators and regulators.
These baselines capture seasonal patterns in vegetation health, enabling precise comparisons with current conditions. They also help identify localized anomalies in reflectance signals that may warrant further investigation. The resulting approach delivers a defensible, scalable method for surface-based monitoring within broader CCS testing and monitoring programs.
Applying Vegetation Monitoring
Vegetation monitoring is currently used at a Class VI well site near Russell, Kansas, to support CARB certification. This effort is conducted in collaboration with the Kansas Applied Remote Sensing Program as part of the site’s baseline monitoring program.
Using satellite imagery, vegetation indices are calculated and validated through periodic field observations. A web-based dashboard enables near real-time visualization of vegetation trends, with updates every 10 days. The platform allows users to view year-over-year changes, compare seasonal baselines, assess land cover transitions, and examine environmental drivers such as temperature and precipitation. It also flags localized hotspots where vegetation conditions deviate from expected norms, helping prioritize areas for closer review.
Questions About Vegetation Monitoring?
Spectral monitoring is most powerful when combined with other tools such as soil gas sensors, atmospheric monitoring, groundwater monitoring, and geophysical surveys. Together, these methods create a multi-layered framework that enhances site safety and strengthens regulatory compliance.
Trihydro continues to expand its use of spectral analytics, including developing web-based applications for real-time anomaly detection and visualization that can be applied across CCS sites and other pollutant monitoring projects. If you have questions about using vegetation monitoring for your testing and monitoring program, contact Trihydro’s specialists for guidance.